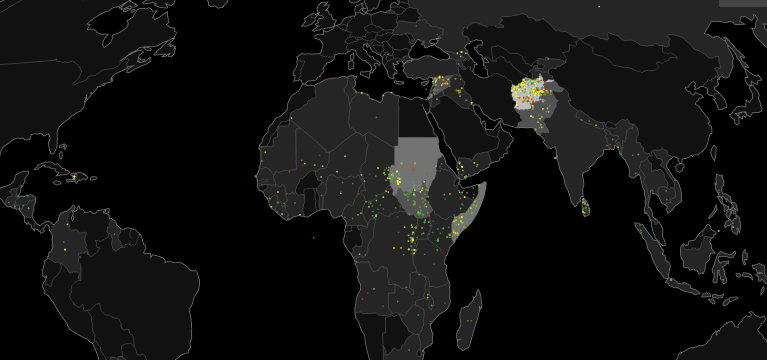
Last year, more than 300 aid workers were killed, wounded or kidnapped, the second-worst year on record.
Despite their charitable intentions, aid workers face criminal as well as ideological or politically-motivated attacks as well as accidental threats in war zones. Afghanistan and Somalia have taken the greatest number of lives, while Sudan and South Sudan are not far behind.
Over recent years, aid agencies have professionalised their risk management, while at the same time they remain under moral and donor pressure not to pull out when things get dangerous. It's a difficult balancing act for aid agency managers to protect their staff while showing commitment, solidarity and an acceptance of calculated risk in their planning.
This map, a joint product between IRIN and Humanitarian Outcomes, is the first time ever the full scope of aid worker security events has been presented in visual form, which can be searched and filtered and browsed. It shows events from the beginning of 2000 until the end of May 2015.
It's a sobering testament to the dangerous work of saving lives.
Data sources
Humanitarian Outcomes have been running the Aid Worker Security Database since 2005, and made it publicly available online in 2010. The database records major incidents of violence against aid workers. It is not absolutely comprehensive as some incidences are not reported, but it is the sole global open source of this data, providing the evidence base for analysis of the changing security environment for aid operations.
Data is collected both through public sources and information sharing with the United Nations, the International Movement for the Red Cross and Red Crescent and many major NGOs.
How the map was created
Within the dataset of over 1,900 incidents, about 700 of the more recent event locations had been geocoded by Humanitarian Outcomes manually. IRIN researched, refined and standardised the remainder through a series of iterations and geocoded them with geographic coordinates using OpenCage, a gateway service linking to a selection of location databases.
When only the country name is known, location data has been randomised within the country borders for viewability, and the popup will show "Unknown". When there are multiple events in the same location, for example, Mogadishu, we again have introduced some offset so different events can be seen.
To geocode over 1,000 events on limited location information, involving variant spellings and other "noise", we have devoted detailed effort in a series of processes, both human and automatic, to arrive at the best possible location of the data points.
Location data underlying the map includes location coordinate data attributable to Nominatim, Open Street Map, and GeoNames, used under Open Database and Creative Commons Licences.
If there are examples where you think the geocoding was particularly inaccurate, please do tell us by emailing [email protected], preferably with the correct coordinates.


